Harbor RLVR environment — figures
Harbor RLVR environment — figures
Figures from harbor-rlvr-environment.md / lilyzh.ng/posts/harbor-rlvr-environment. Captions are copied verbatim from the published figcaptions. Relative paths so a normal markdown preview renders them.
Paper-plot triage (compact + informative enough for /paper-plot):
| Fig | File | Verdict |
|---|---|---|
| 1 | tb2-teaser-v9-light.svg (prefer light) / tb2-teaser-v8.svg (blog dark) |
Yes, after restyle — method overview; light variant is closer to paper |
| 2 | tb2-taxonomy-v2-design.svg |
Maybe — informative system diagram, too tall/busy for single-column without cutting labels |
| 3 | tb2-taxonomy-fig-1.svg |
Yes — compact L1 mix; primary problem setup |
| 4 | tb2-taxonomy-fig-2.svg |
Yes — silent-trial funnel; design rule in one glance |
| 5 | tb2-taxonomy-fig-3.svg |
Yes (best data chart) — reward-design headline |
| 6 | tb2-taxonomy-fig-4.svg |
Yes — early-step cluster; justifies MAX_TURNS |
| 7 | tb2-data-fig-corpus-vs-sample.svg |
No for paper bootstrap — data-prep detail; keep as design-plot |
| 8 | tb2-data-fig-sample-vs-eval.svg |
No for paper bootstrap — busy category compare; appendix/blog only |
Note: figs 3–6 are currently dark Solarized (blog). Paper use means white canvas + pastel/ink restyle via /paper-plot from-design.
Figure 1 — Method pipeline
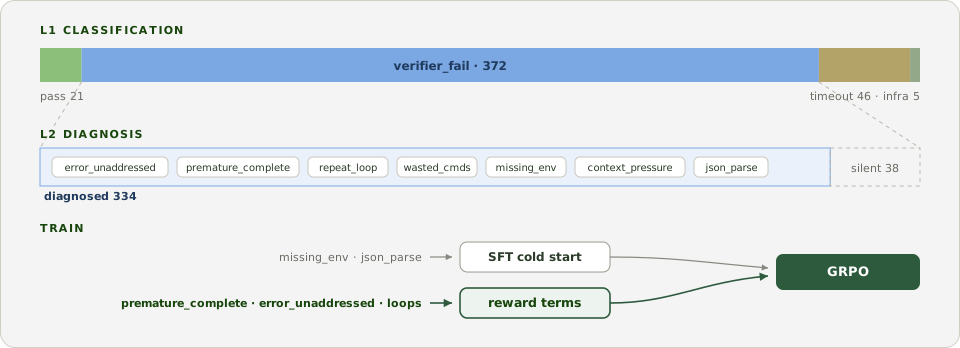
Figure 1: The pipeline. Classify what happened (L1), diagnose why (L2), then split by failure type: knowledge gaps go to SFT, decision failures become reward terms for GRPO.
Figure 2 — Taxonomy as a system
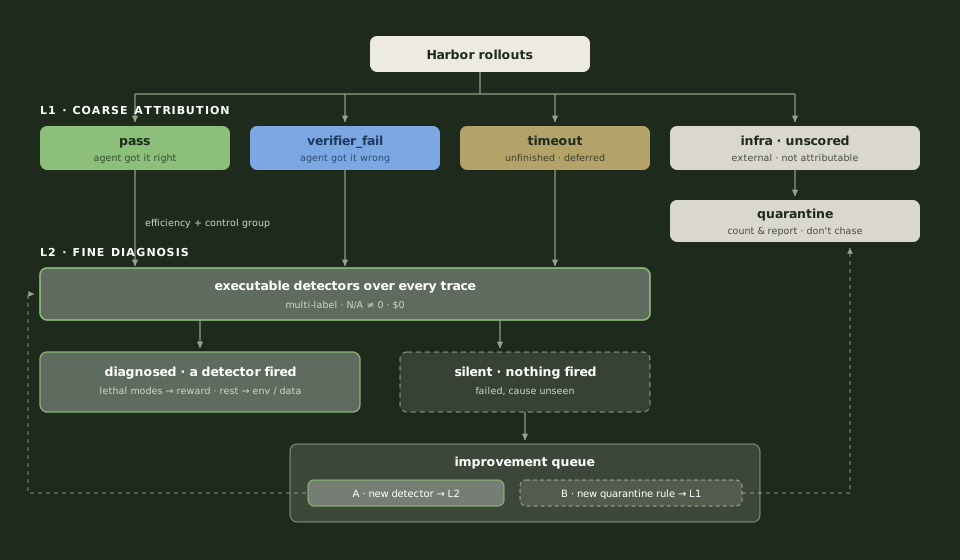
Figure 2: The taxonomy as a system. L1 does coarse attribution (who is responsible) and quarantines what can’t be attributed; L2 runs the executable detectors over every attributable trace, pass included (passes are the control group for the failure modes). Every silent trial exits the improvement queue one of two ways: A, a failure we have no detector for, so we build one and L2 grows; or B, the task or verifier itself is broken, so we add a quarantine rule and L1 grows.
Figure 3 — Harbor L1 outcomes
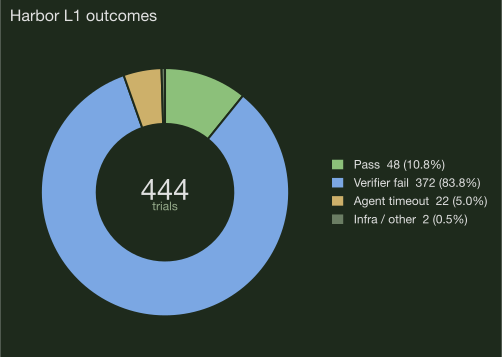
Figure 3: Harbor L1 outcomes. Mostly verifier_fail (~84%), not timeout. The learning problem is how the agent fails the verifier.
Figure 4 — Analysis funnel
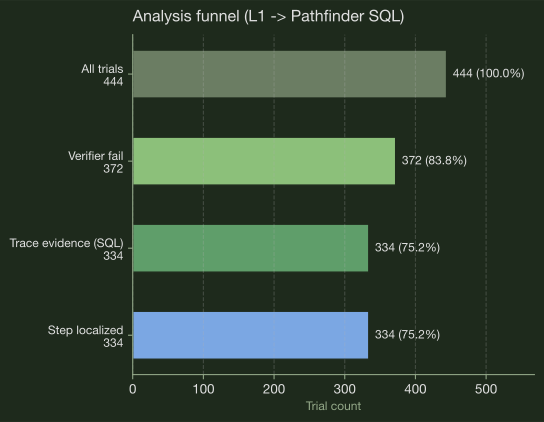
Figure 4: Analysis funnel. 38 silent trials: verifier failed but no ATIF signal for a mode penalty. Design rule: only penalize computed trace evidence.
Figure 5 — Executable failure modes
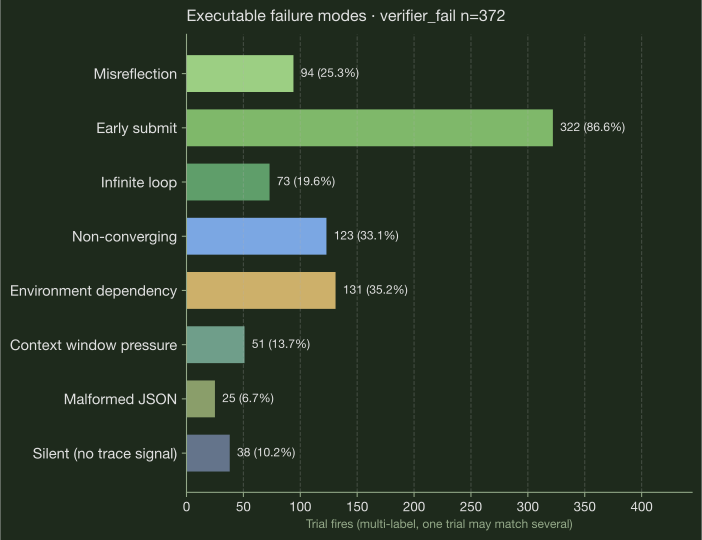
Figure 5: Executable failure modes. Primary chart for reward design. Headline: the missing-reflection family (premature_complete + error_unaddressed) fires 434+ times across multi-label trials.
Figure 6 — Failure step distribution
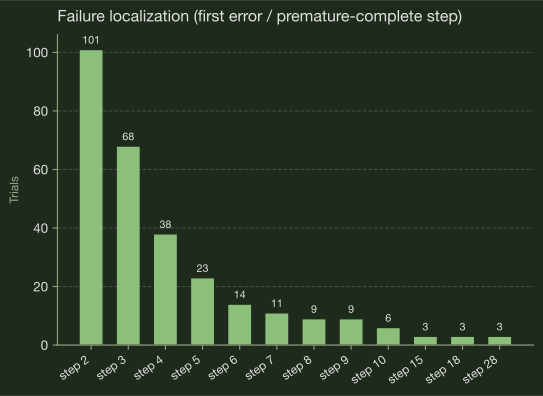
Figure 6: Failure step distribution. First failures cluster at steps 2–3, not the turn cap. Bottleneck is wasted actions early, not horizon length.
Figure 7 — Corpus vs balanced sample
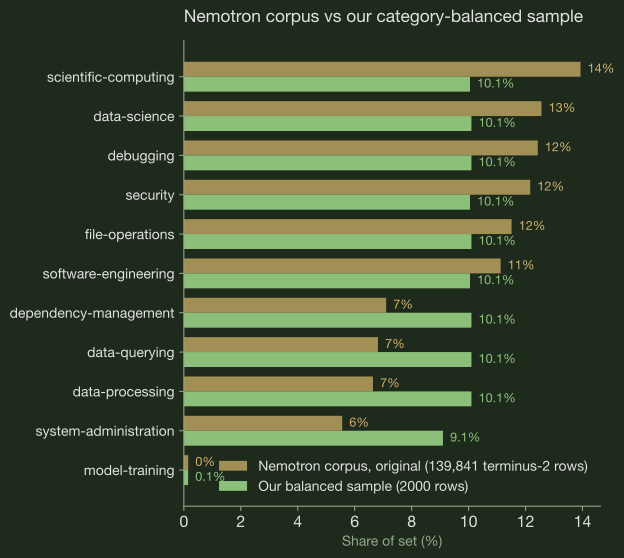
Figure 7: Source corpus vs the first-round sample: each of the 11 categories gets an equal share.
Figure 8 — Sample vs eval anchor
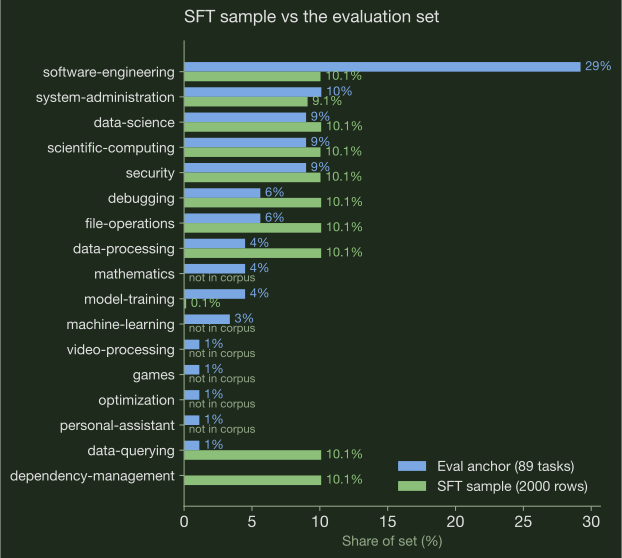
Figure 8: The same sample vs the eval anchor. Six eval categories do not exist in the corpus at all; model-training survives the quality gates with only 3 rows.